Global Approaches to Betting Odds Comparison and Value Hunting in 2026
Elena Neumann · Aug 24, 2026
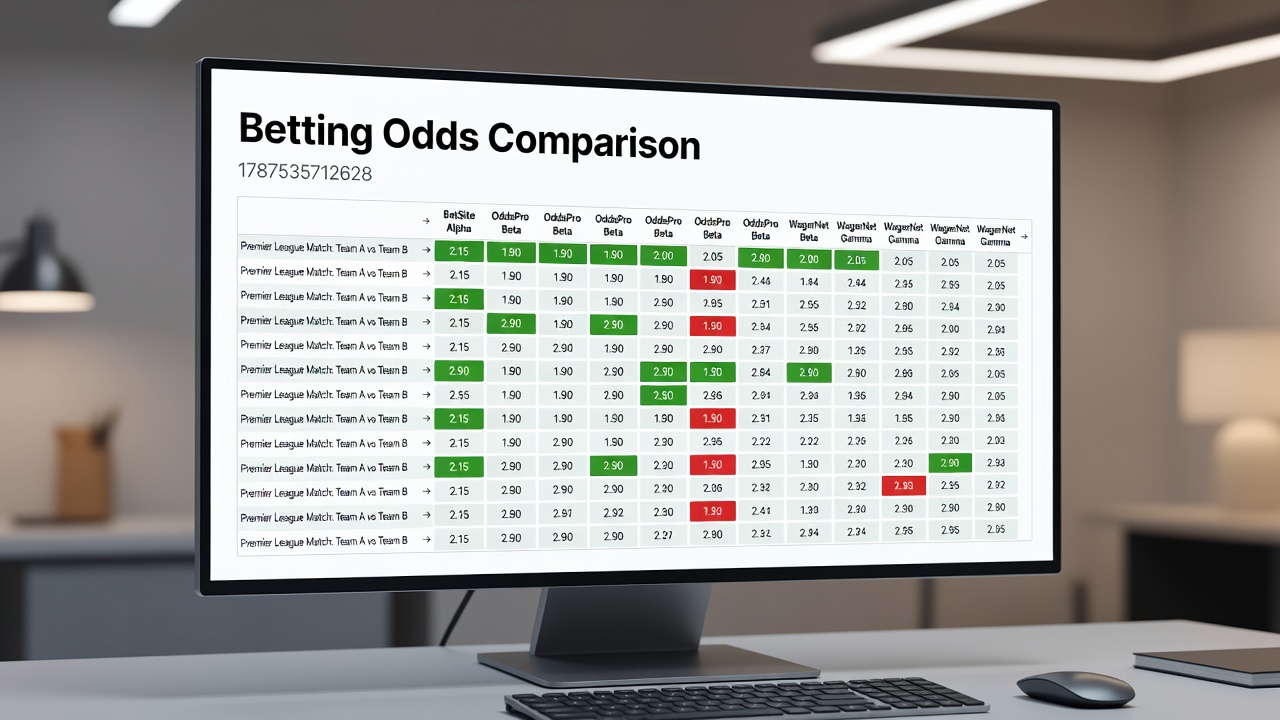
Global Approaches to Betting Odds Comparison and Value Hunting in 2026
Betting odds comparison involves examining lines from multiple operators to identify the most favorable payouts on events ranging from football matches to horse racing and tennis tournaments, and data from various international markets shows consistent use of these methods among participants seeking measurable edges. Observers note that discrepancies arise when bookmakers adjust prices based on regional regulations, betting volume, and real-time information, which creates opportunities for those who track movements across platforms.
How Comparison Mechanisms Operate Across Regions
Operators in different jurisdictions calculate odds using proprietary models that factor in historical performance, injury reports, and market liquidity, while independent comparison services aggregate these figures into searchable databases that update continuously. Researchers at institutions studying gambling behavior have documented that users who cross-reference multiple sources often secure higher returns on the same outcome, particularly in accumulator bets where small percentage improvements compound across selections. In August 2026, upcoming fixtures in European leagues and North American sports leagues coincide with heightened activity as platforms adjust lines ahead of major tournaments.
Take one analysis conducted through European betting data aggregators that revealed average variance of 4 to 7 percent between the highest and lowest odds on popular football markets, a gap that widens during live play when in-game developments prompt rapid recalibrations. Those monitoring these shifts frequently combine comparison tools with promotional credits to offset margins, though success depends on timing and operator terms that differ by country.
Key Tools and Their Integration With Market Data
Specialized websites and mobile applications pull feeds from dozens of licensed operators in places such as Australia, Canada, and parts of the United States, presenting side-by-side tables that highlight best available prices for each selection. Industry reports from the American Gaming Association indicate that online sports wagering volumes have expanded steadily through 2026, with comparison features cited as a common entry point for new participants entering regulated markets. Users can set alerts for specific events, allowing automatic notifications when an odds movement exceeds a predefined threshold.
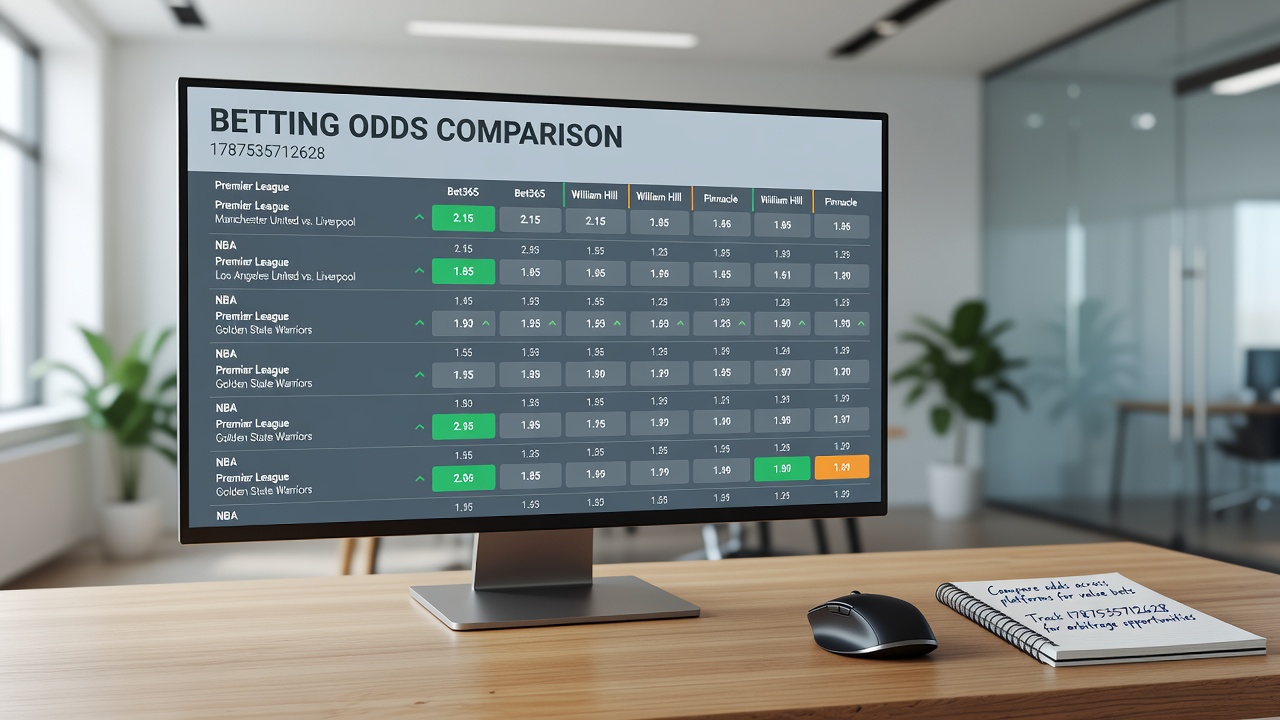
Academic studies published by university research groups have examined how these platforms influence decision patterns, finding that structured comparison reduces reliance on single-operator loyalty and encourages diversification across providers. In practice, bettors often layer live odds tracking onto pre-match research, switching between football accumulators and tennis point-by-point markets as matches progress, while horse racing enthusiasts apply similar logic to each race card.
Regulatory Contexts and Cross-Border Considerations
Government agencies outside the United Kingdom maintain separate oversight frameworks that shape how odds are displayed and promoted, with entities such as state-level regulators in the United States and provincial bodies in Canada requiring clear disclosure of terms that affect payout calculations. Data compiled by the Australian Institute of Family Studies shows measurable differences in average returns between domestic and international-facing operators, prompting users to verify licensing before committing funds. These variations become especially relevant when events span multiple time zones, as late adjustments in one region can create brief windows of misalignment visible through global comparison services.
What's interesting is how accumulator strategies evolve when participants incorporate live data feeds, since small edges identified through comparison compound over multiple legs while remaining subject to each operator's settlement rules. Observers tracking August 2026 schedules point to packed calendars in tennis and football that historically generate elevated comparison activity, with horse racing cards providing additional volume during evening sessions in different hemispheres.
Trends Emerging in Mid-2026 Markets
Market participants increasingly combine comparison outputs with statistical models that factor weather conditions, player form, and historical head-to-head records, producing probability estimates that operators then translate into decimal, fractional, or American formats. Reports from gaming trade associations in North America highlight that mobile access to real-time lines has accelerated the pace at which discrepancies appear and disappear, requiring users to act within narrow timeframes. Those applying systematic approaches often maintain records of past comparisons to refine future selections, though outcomes remain governed by the inherent uncertainty of sporting events.
Cross-sport accumulators linking tennis sets with football goal totals demonstrate how comparison extends beyond single events, allowing alignment of prices from separate operators when one platform offers superior value on one leg while another leads on the remainder. Regulatory updates in several jurisdictions continue to emphasize transparency around bonus wagering requirements, which directly affect the net return after any odds advantage is secured.
Conclusion
Betting odds comparison functions as a practical method for navigating price differences across global operators, supported by aggregated data feeds and regulatory disclosures that vary by region. Participants in August 2026 continue to apply these techniques to football, tennis, and racing markets amid evolving schedules, with tools that aggregate live movements providing the primary mechanism for identifying measurable differences. Evidence from multiple international sources confirms steady adoption of comparison practices wherever licensed operators compete on the same events.