Global Tools for Comparing Betting Odds Across Markets
Mara Washington · Aug 26, 2026
Global Tools for Comparing Betting Odds Across Markets
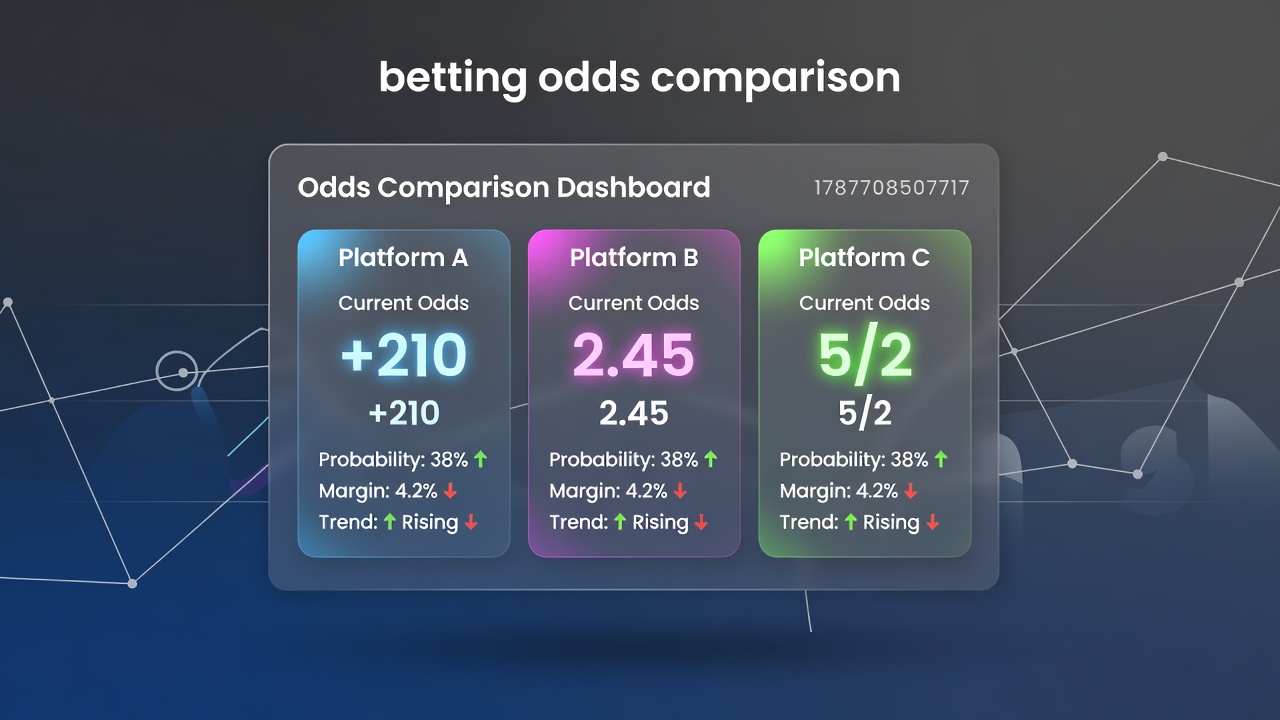
Betting odds comparison involves aggregating prices from various operators so that participants can identify the highest returns available for a given selection, and platforms performing this function have expanded their coverage to include football, tennis, horse racing along with emerging digital sports. Data from industry reports indicate that users who cross-reference multiple sources before placing wagers secure better implied probabilities, while regulatory filings in several jurisdictions track how these services influence overall market activity.
Core Mechanics Behind Odds Aggregation
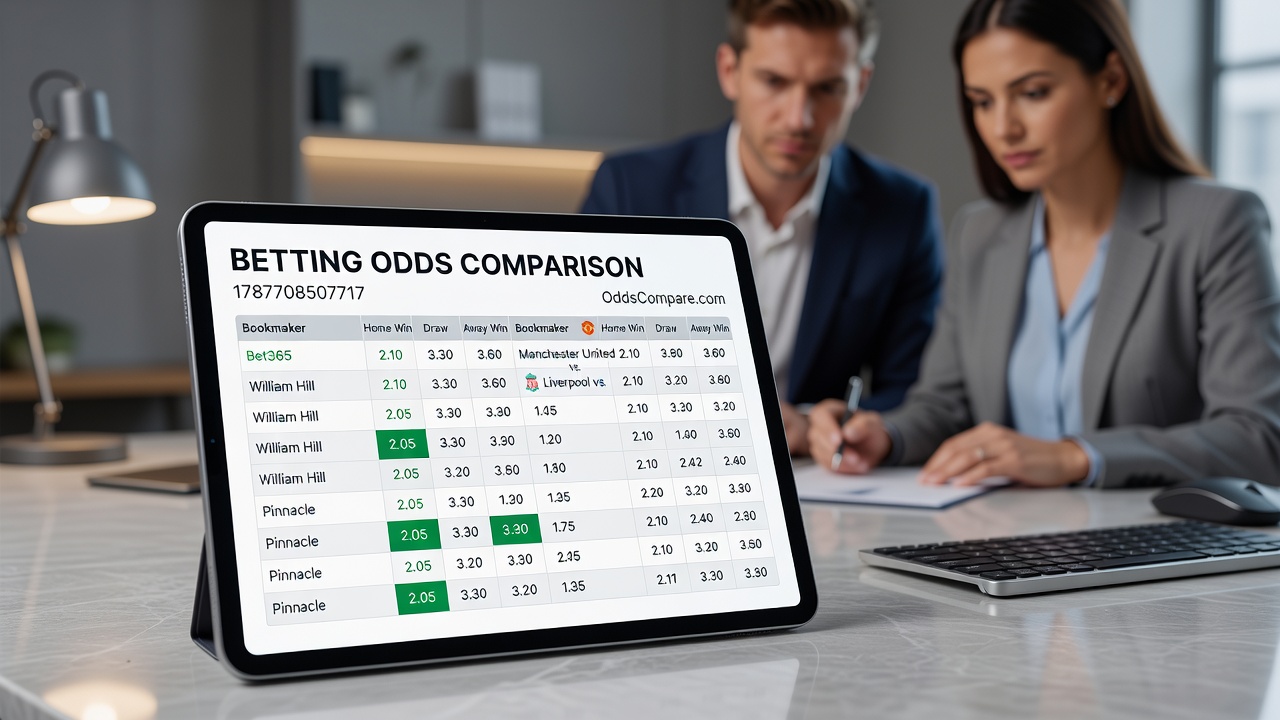
Operators calculate odds using statistical models that factor in team performance metrics, historical results, and margin adjustments, yet comparison services pull live feeds from multiple books simultaneously and display them side by side. Observers note that this process reduces the time required for manual checking, and software updates in August 2026 introduced faster refresh rates for in-play markets where prices shift rapidly during live events. Those who study the sector report that synchronization accuracy improved after several platforms adopted standardized API protocols, allowing participants to spot discrepancies within seconds rather than minutes.
Regional Data on Platform Adoption
Figures released by the American Gaming Association reveal steady growth in the number of users accessing odds comparison tools within regulated US markets, whereas Australian research institutes have documented similar patterns among online participants who monitor both domestic and international books. European studies from independent academic groups highlight that cross-border comparisons often surface value in niche leagues where liquidity varies between operators. These patterns hold even as payment methods and currency conversions add layers to the final payout calculations.
Practical Applications in Major Sports
Football accumulators benefit when bettors compare pre-match and live odds across providers, because small percentage differences compound across multiple legs. Tennis markets show similar dynamics during Grand Slam tournaments, where set-by-set pricing can diverge sharply between books offering different risk models. Horse racing enthusiasts frequently check morning line versus starting price movements, and comparison sites flag when early odds shorten or lengthen based on exchange activity. One case documented by university researchers found that consistent use of these tools correlated with higher average returns over a full racing season, although individual outcomes still depend on selection accuracy and bankroll management.
Technology Driving Real-Time Updates
Cloud-based scraping and machine learning algorithms now power most comparison engines, scanning hundreds of books for price changes while filtering out temporary errors or suspended markets. Industry organizations in Canada have tracked how these systems handle high-volume periods such as major football weekends, when traffic spikes test server capacity and data latency becomes critical. Participants gain access to historical odds archives on many platforms, enabling analysis of line movement trends that inform future decisions rather than reactive betting.
Regulatory Context and Consumer Protections
Government agencies outside the UK, including those in Australia and parts of the European Union, require certain transparency standards for odds display and have introduced rules around advertising accuracy. Reports from these bodies show increased scrutiny of bonus terms that accompany compared odds, because promotional conditions can alter net value even when headline prices appear superior. Observers note that licensed operators must maintain clear records of odds sources, which helps comparison services verify legitimacy before listing new providers.
Future Developments Expected by Late 2026
Analysts anticipate further integration of predictive analytics into comparison dashboards, allowing users to view projected value scores alongside raw prices. Academic papers published in 2025 already examined early prototypes that combine odds data with weather or injury feeds, and several services plan to roll out similar features before the end of the year. Market participants who monitor these updates stand to gain from faster identification of mispriced selections across global events.
Conclusion
Betting odds comparison continues to evolve through technological refinement and expanding regulatory oversight, delivering structured access to pricing information that spans multiple sports and regions. Evidence from government reports and research institutions shows measurable differences in outcomes for those who apply systematic comparison practices, while platform improvements scheduled through 2026 aim to maintain accuracy amid growing data volumes. The sector's trajectory depends on continued collaboration between operators, aggregators, and oversight bodies to sustain reliable information flows for all participants.